Note: This post has been adapted for publication from an academic paper. Thank you to guest contributor Jason O’Neill (Engineered Services) for the rights to publish.
This article compares potential solar proposals in Washington, D.C., Boston, MA, and Seattle, WA. Preliminary data for the monthly energy production at each site using PVWatts and a Commercial Distribution system with a nameplate design of 200 kWh is pulled from the National Renewable Energy Laboratory’s (NREL) System Advisor Model (SAM) database:
Washington, D.C. – 276,343 kWh Annual Energy
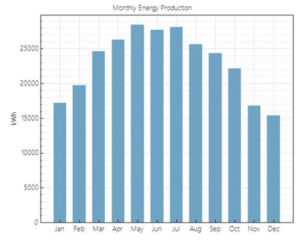
Figure 1: Monthly energy production for a commercial solar system in Washington, D.C. (System Advisor Model, 2019).
Boston, MA – 261,757 kWh Annual Energy
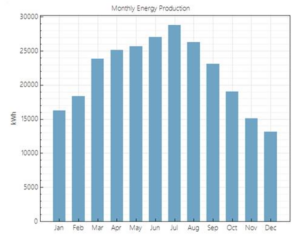
Figure 2: Monthly energy production for a commercial solar system in Boston, MA (System Advisor Model, 2019).
Seattle, WA – 219,583 kWh
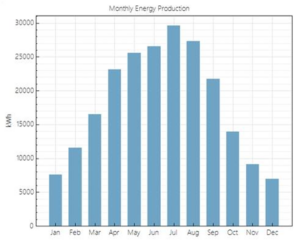
Figure 3: Monthly energy production for a commercial solar system in Seattle, WA (System Advisor Model, 2019).
Figures 1 – 3 above demonstrate that based on energy output alone, solar projects would be most attractive in Washington, D.C., followed by Boston, and finally by Seattle (which suffers from a large drop-off in monthly kWh production during fall, winter, and early spring).
However, this doesn’t tell the full story of the economics of the Solar Energy Collection Systems (SECS) in these three areas. Local incentives, tax credits, and financing tools all come into play to determine the best locations to develop solar.
Federal Tax Credit
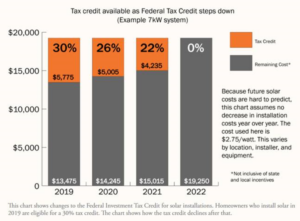
Figure 4: Available Federal Investment Tax Credit for solar installations for both residential and commercial applications. (Solar United, 2019).
The first incentive available is the Federal Investment Tax Credit shown in Figure 4. This program provides a tax credit for 30% of the total cost of installation for both residential and commercial solar systems installed anywhere in the country. However, the credit has not been renewed and starting in 2020, will begin its process of expiration, dropping to 26% in 2020, 22% in 2021, and disappearing entirely by 2022 (Solar United, 2019). This process will go into effect barring a decision by Congress to extend the tax credit again and is accessible in all three locations selected.
Solar Renewable Energy Credit (SREC)
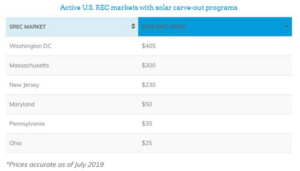
Figure 5: Active US SREC markets and current pricing as of July 2019. Washington, D.C. offers the highest prices by a large margin (Energy Sage, 2019).
Solar Renewable Energy Credits (SRECs) represent the “green” value of electricity generated from solar sources and operate like a voucher for clean energy generated by commercial or residential sources (Solar United, 2019). Eligible installations earn one SREC for every 1,000 kWh (1MWh) of clean energy produced by the system (Solar United, 2019). These vouchers can then be sold in a regulated market because many utilities are required to purchase them each year in order to meet the sustainability requirements set by the Renewable Portfolio Standards (RPS) in many states (Solar United, 2019). SREC calculations can be complex, but the rule of thumb is to multiple your generation capacity by 1.2 to find your likely SREC amount (Energy Sage, 2019). For instance, if a resident or business has a 5 kW system, they should earn roughly 6 SRECs per year.
Figure 5 shows that there is considerable difference between the prices of SRECs around the country. Washington, D.C. leads the nation by a large margin with pricing of $405 per SREC. For the example cited above for a 5 kW system earning 6 SRECs, this would mean a yearly rebate to the owner of the system of $2,430. An owner in Ohio would only receive $150. Washington, D.C. is closely followed by another study site, with Massachusetts SRECs of $300 per credit being available in Boston. Washington state however, does not offer any SRECs, so this program would not be available for support in Seattle.
Property Assessed Clean Energy (PACE) Loans
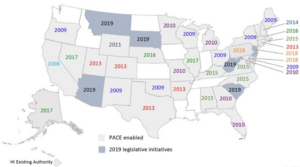
Figure 6: PACE loan eligibility and potential legislative initiatives across the US (PACE Nation, 2019).
Property Assessed Clean Energy (PACE) loans are available to provide loans for energy efficiency improvements, renewable energy systems, or a combination of the two, and are designed to be low cost, long-term project financing (PACE Nation, 2019). A property owner interested in a capital improvement for renewables or energy efficiency would contact their local PACE administrator to secure financing for the project, then repay that financing over a period of multiple years (usually 20-30) through a special assessment on the property owner’s property tax bill (PACE Nation, 2019). By paying back the loan over a long period, the energy savings from the project can essentially “pay for” the loan each year, allowing the project to be cash flow positive from the close of financing in many cases. PACE loans are authorized in Washington D.C. through DC Law 19-262 in 2013 for both commercial and residential, in Massachusetts through Title II, CH.23M in 2016 for commercial only, and are not available in Washington state, so Seattle would not be eligible to use them (PACE Nation, 2019).
Local Incentives
In addition to the above national programs, many states have local incentive programs, as well. Washington state authorized the Washington State Renewable Energy System Incentive Program (RESIP) in 2017 that provided an annual incentive payment of up to $5,000 per year for 1 kW through 12 kW systems and up $25,000 per year for systems above 12 kW. While this would be a very attractive incentive plan for solar for a site in Seattle, the Washington State Utility (WSU) Energy program announced they would accept no new incentive applications after June 14, 2019 (Solar Washington, 2019). It is unclear when, or if, the program will be reinstated.
Massachusetts offers both the Residential Renewable Energy Income Tax Credit and the Solar Massachusetts Renewable Target (SMART) program (Energy Sage, 2019). The tax credit allows the owner of a renewable energy system to get a 15% coverage of their state income tax, up to $1,000 per year. The SMART program pays owners of solar arrays a fixed rate per kWh for solar energy produced for 10 years (Energy Sage, 2019). Remuneration for systems under 25 kW ranges from 29-31 cents per kWh (significantly higher than the average rate in MA of 20 cents per kWh, making this potentially very lucrative) (Energy Sage, 2019). Higher rates are available for low-income customers or those who couple their systems with battery storage (Energy Sage, 2019).
Washington, D.C. does not offer any local incentives.
Location Recommendations
The information above allows one to determine where to prioritize solar development and what type of development it should be. Based on annual energy production for PV, Washington, D.C. is the most attractive option with Boston being a close second. Due to this high output amount, commercial solar installations in these areas is a smart move. Utility scale may be more difficult to implement due to the high price of land in both locations. Seattle, with its cloudier weather, has a significantly lower solar resource, meaning that large scale systems will have a more difficult time repaying their investment cost, so a smaller residential system here would be better.
Moving on to incentives and financing, all three sites can use the Federal Renewable Tax Credit, so this is a wash for all sites (with the potential exception of Seattle where a residential system might be able to be completed fast enough to still take advantage of the higher 2019 30% credit). The SRECs really drive the potential benefits here though, making Washington, D.C. and Boston, MA look even more attractive with their $405 and $300 SREC pricing, respectively, and Seattle being unable to utilize SRECs at all. PACE financing again makes the project much easier to pay for and is also available in DC and Boston, but not in Seattle. Seattle’s primary selling point would be the RESIP incentive program, but with this currently discontinued, Massachusetts gets the edge for providing an attractive rebate program.
Given the above and Washington D.C.’s higher solar resource, high SRECs, and ability to use both the federal tax credit and PACE financing, DC would be ideal among the three scenarios for a commercial installation.
Works Cited
Energy Sage, 2019. https://news.energysage.com/srec-prices-explaining-u-s-srec-solar-market/ (Links to an external site.)
PACE Nation, 2019. https://www.pacenation.org/wp-content/uploads/2018/09/Legislative-map-9.11.2018.png (Links to an external site.)
Solar Washington, 2019. https://www.solarwa.org/solar_incentives (Links to an external site.)
Solar United, 2019. https://www.solarunitedneighbors.org/learn-the-issues/solar-incentives/solar-renewable-energy-credits-srecs/ (Links to an external site.)
System Advisor Model, 2019.
